
July 24, 2025 — KOTEM is pleased to present the latest features of the powerful EVOLVE Suite of software packages. EVOLVE enables you to efficiently define, communicate, and monitor design intent across your manufacturing enterprise.
The EVOLVE 12.0 Suite comprises (4) software packages:
What’s new in EVOLVE SPC 12.0?
Major Enhancements
- SPC Result Visualization of Location and Control Point types of characteristics
- “Always show all labels” display mode
- Default label options for the 3D view
SPC Result Visualization
- The SPC Result visualization feature is available when EVOLVE project files are imported, and the results contain Location (PTOL) or Control Point (CTRLPNTs) type of characteristics.
- You can activate SPC result visualization from the Characteristic panel or by using the new Display selector in the CAD Model window.
- The SPC Results will then appear in the CAD Model window.
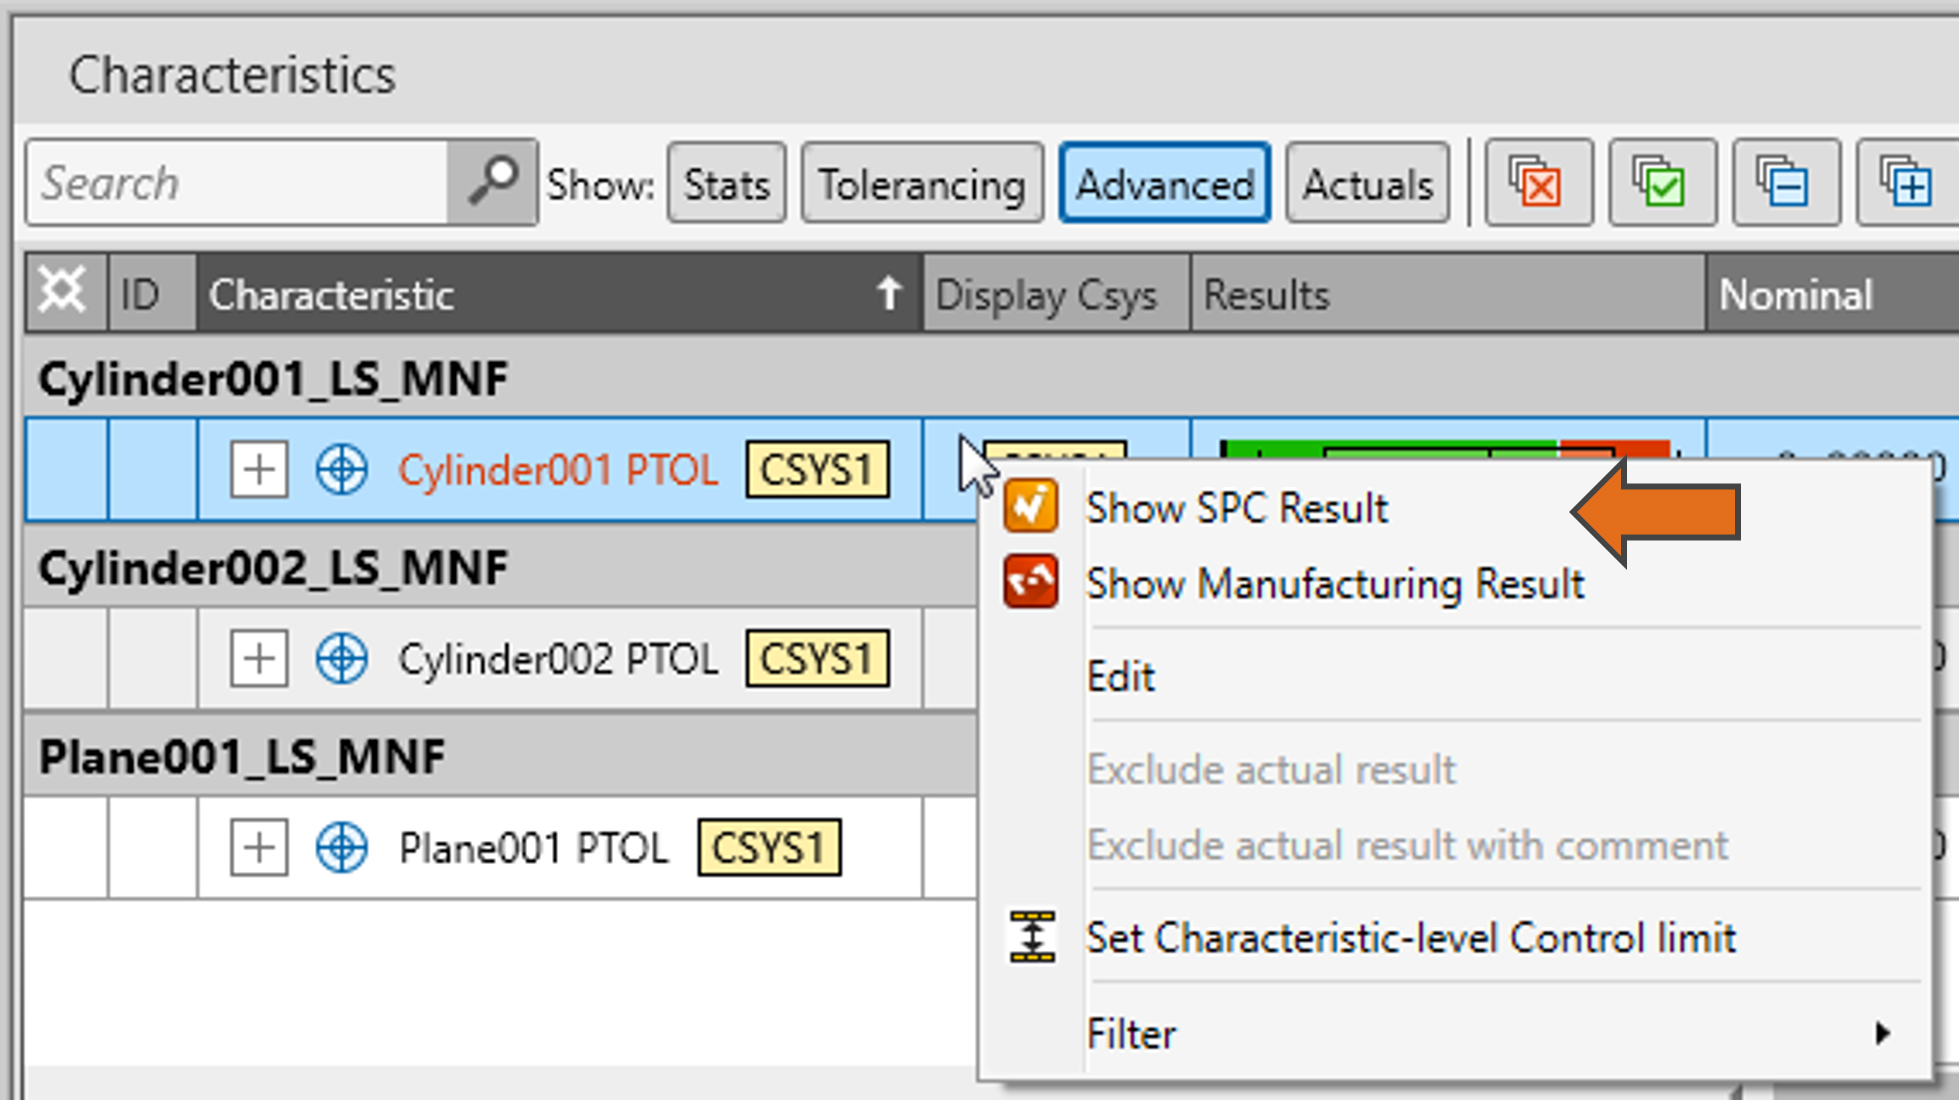
Activate SPC Result Visualization #1
Characteristics panel
- Right click → Show SPC result, or
- Double click the characteristic to activate its SPC result visualization
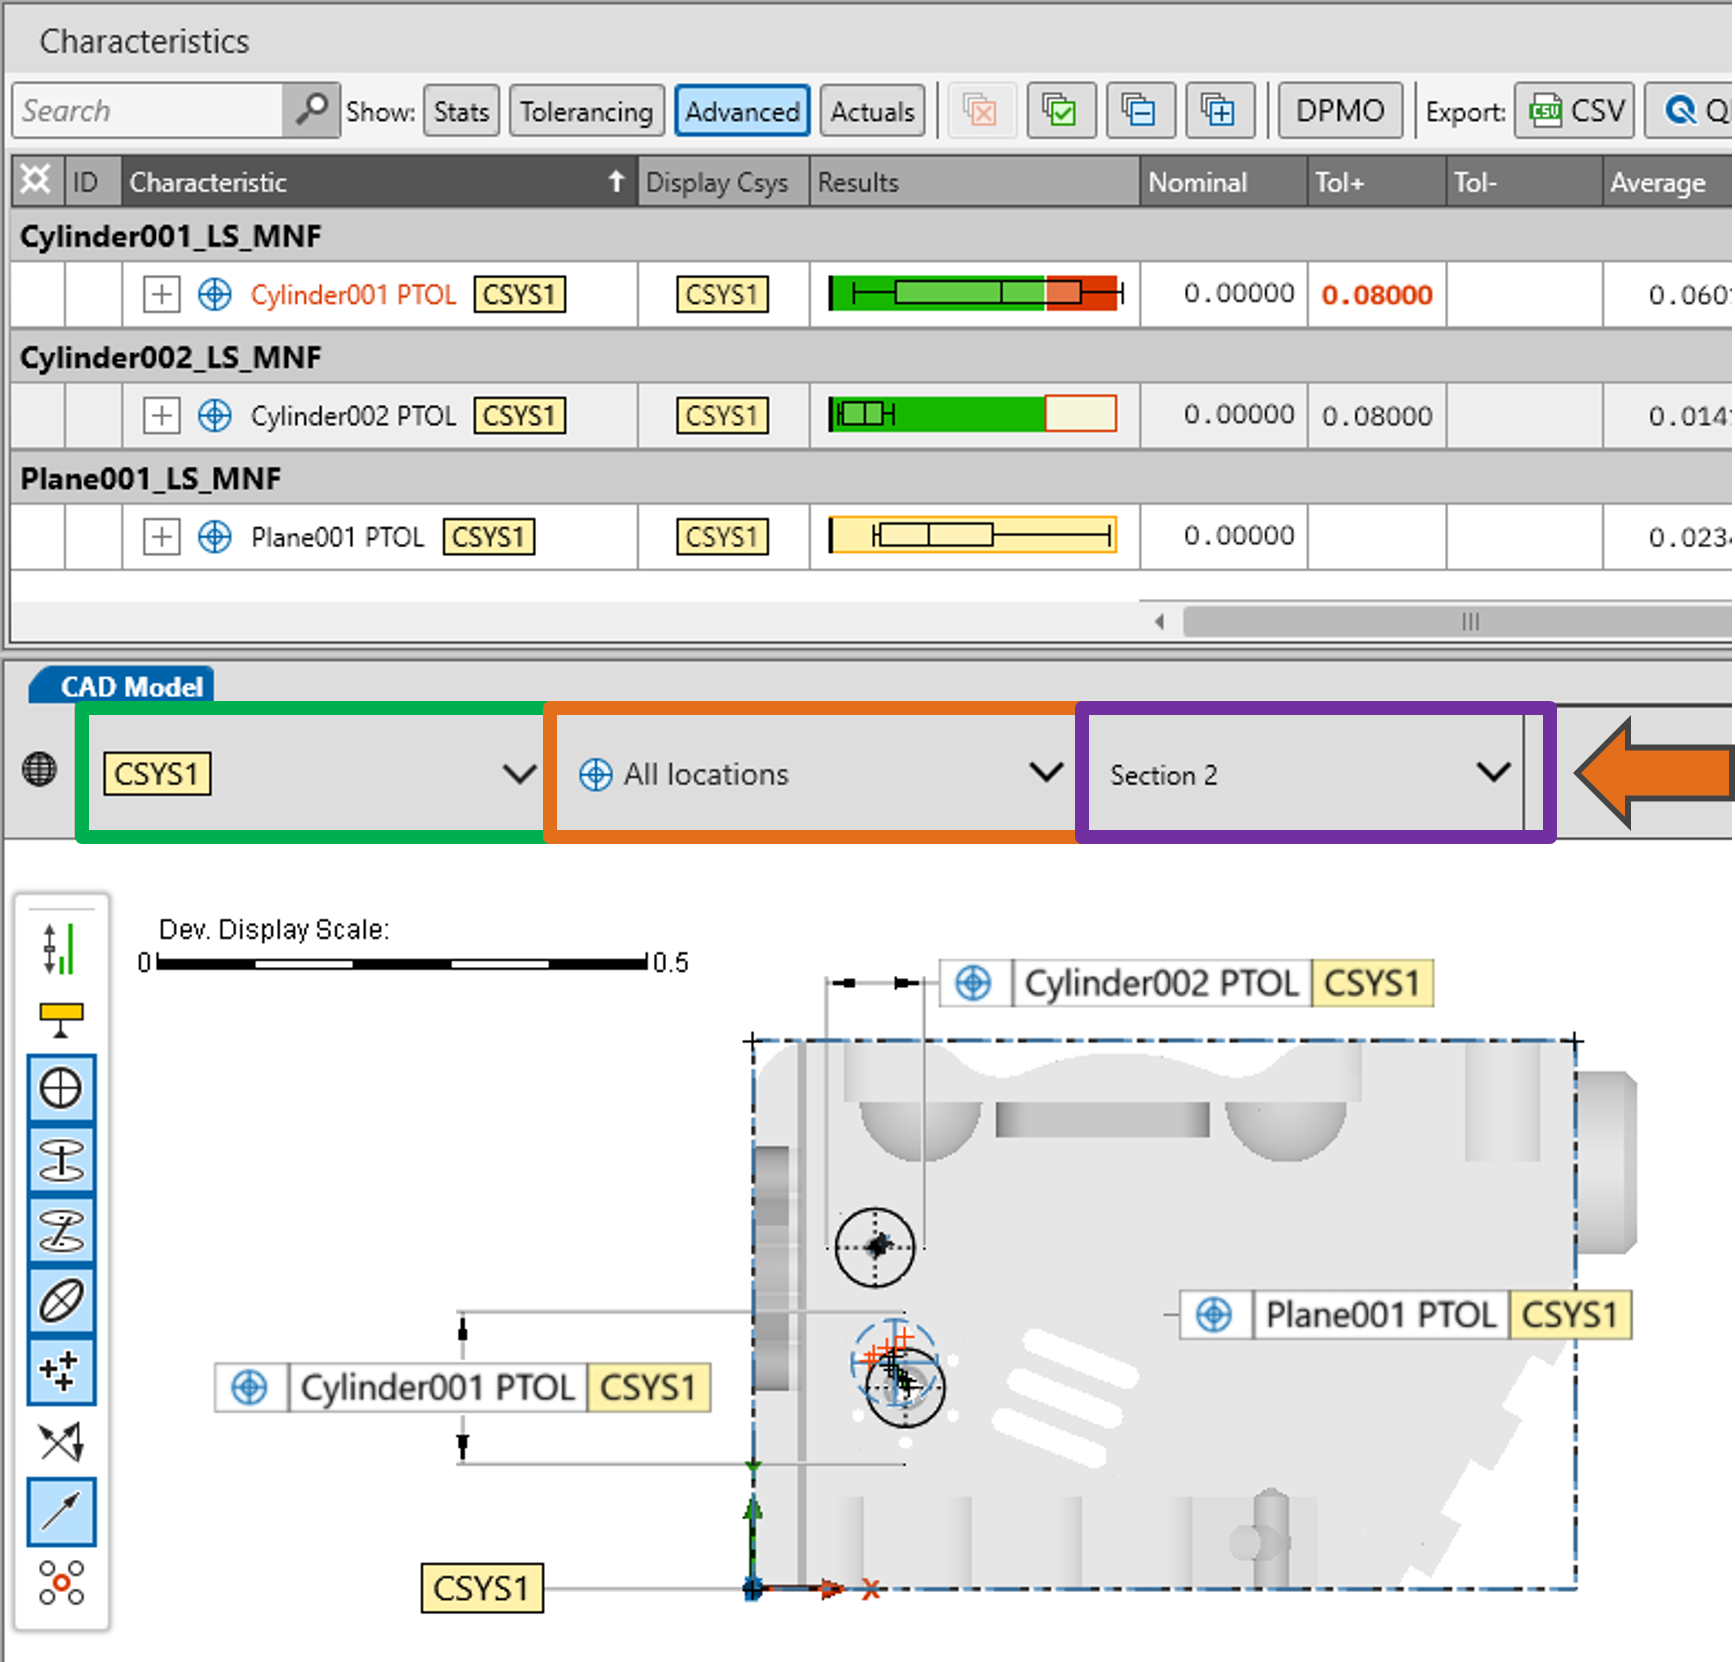
Activate SPC Result Visualization #2
Display selector – available in the CAD Model window and contains the following components:
- Alignment selector
- Lists the alignments with location or control point type of characteristics.
- The alignment selection filters the characteristics in the characteristic table.
- Characteristic selector
- Result type selector
- Location visualization – filter the result view to the segment of your interest (top, bottom or average).
- Control points visualization – select the statistical basis for the heatmap colorization.
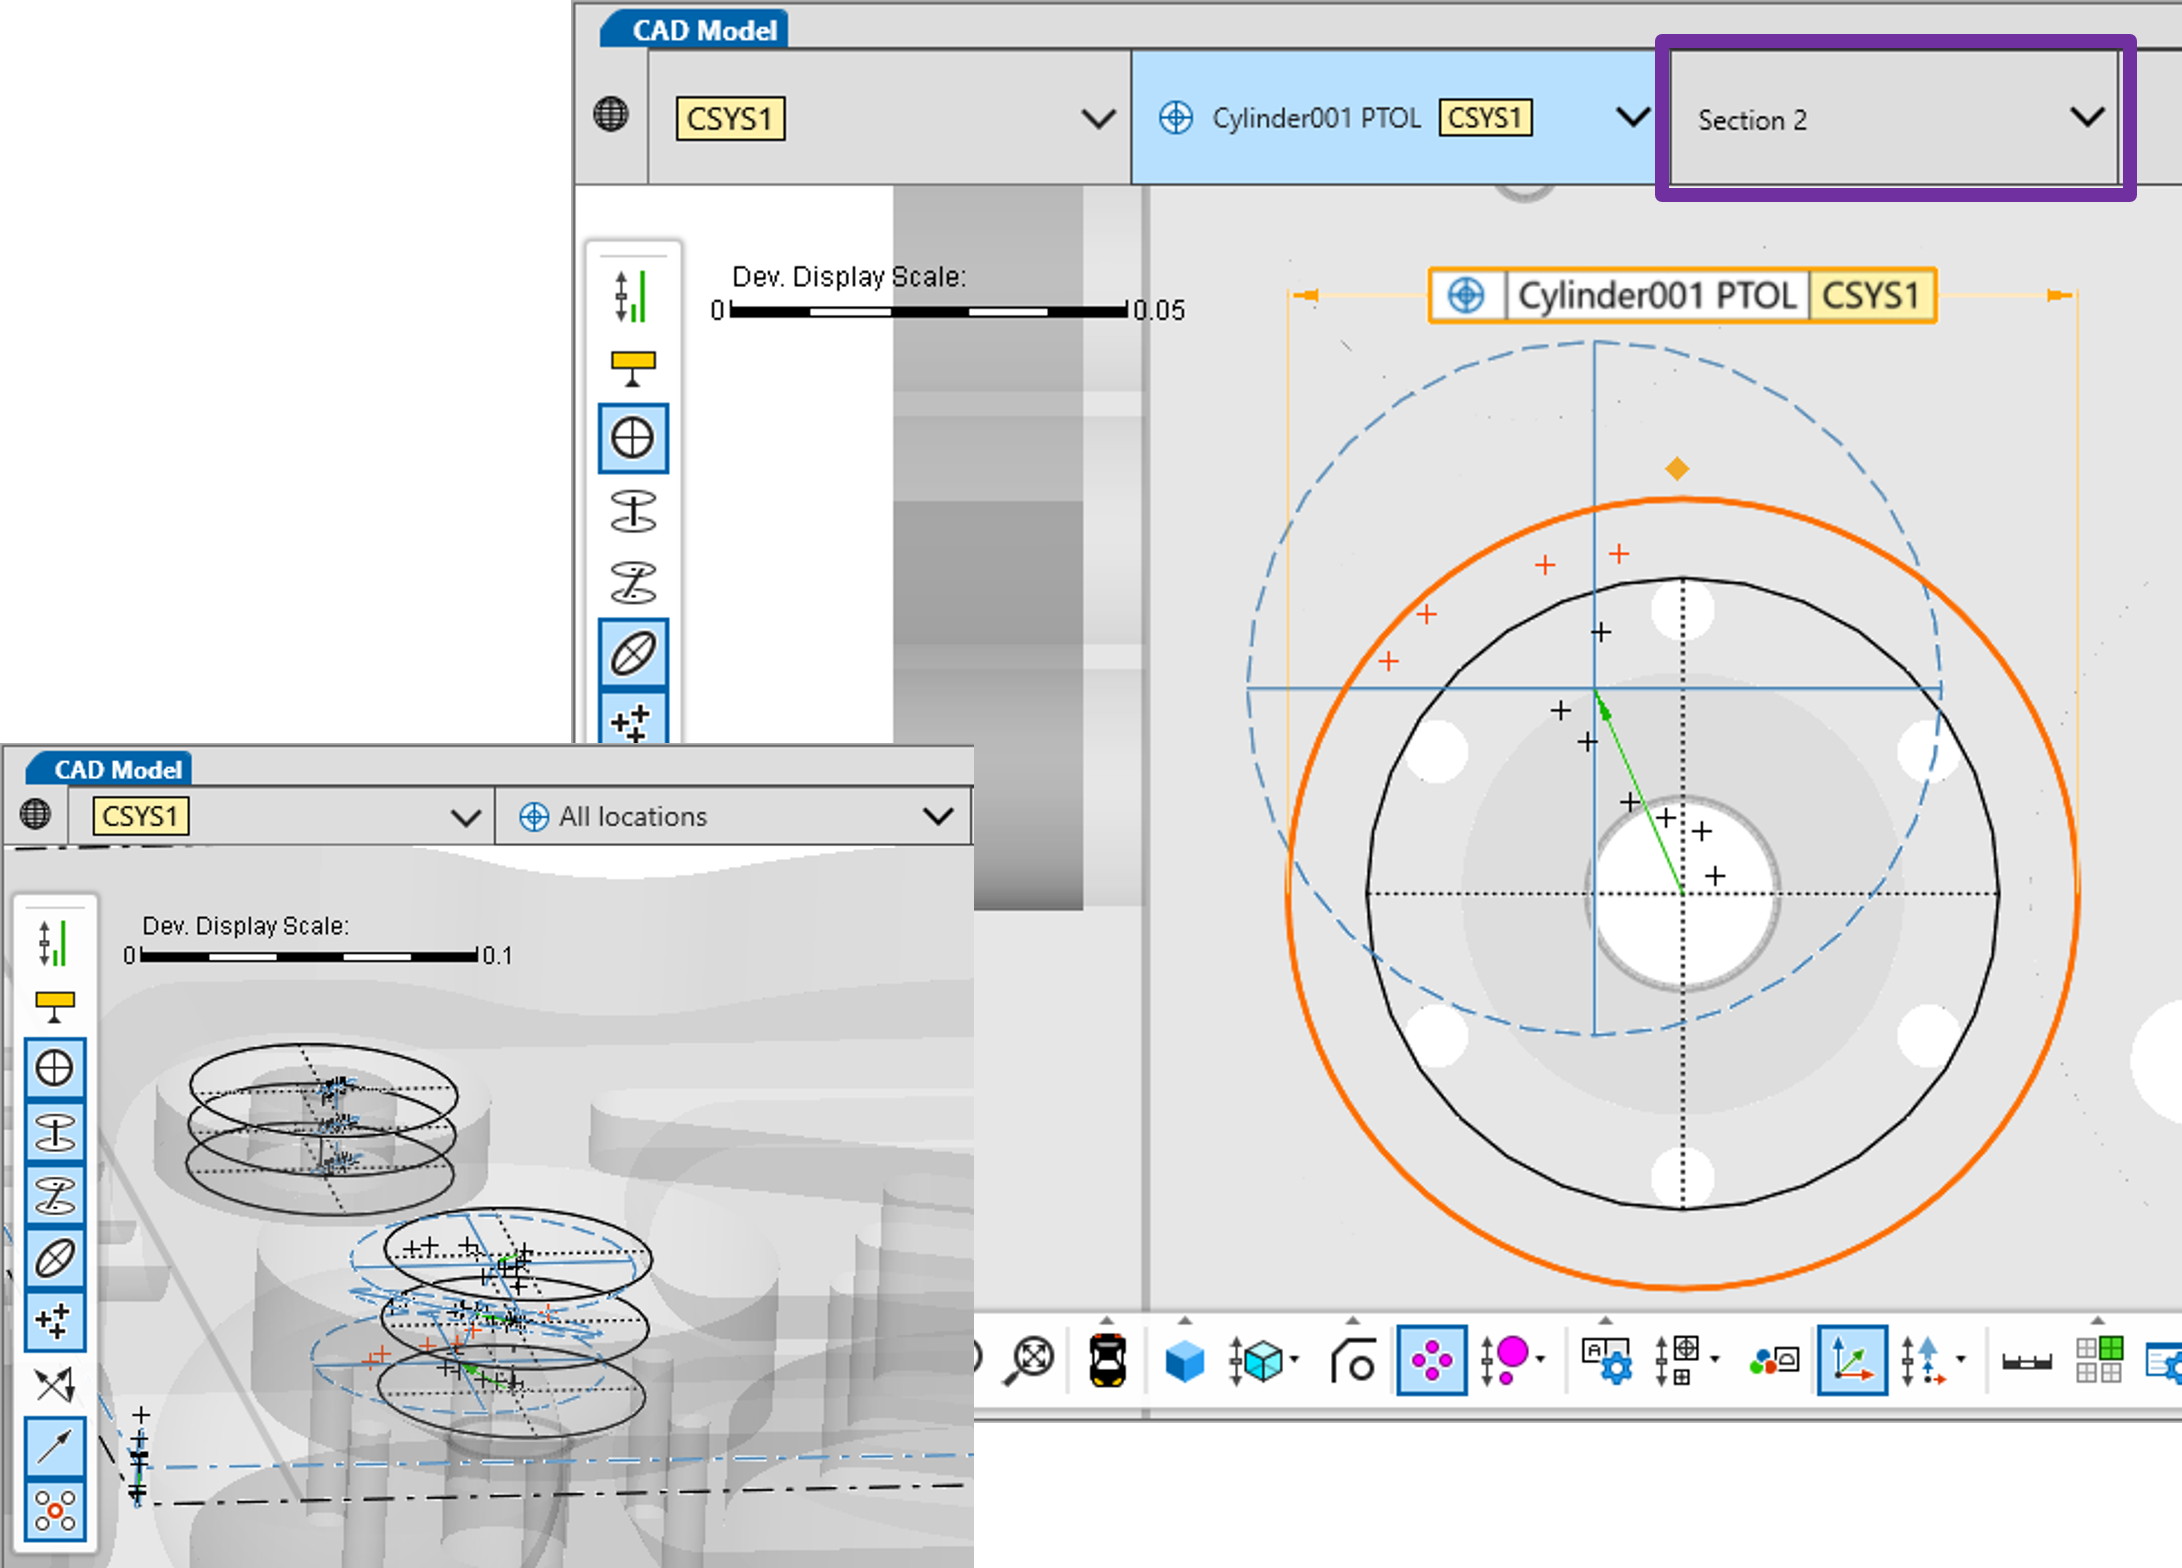
Location Result Visualization
The scatter plot chart has been integrated into the CAD model, allowing you to see position errors right at the location of the tolerated feature.
- Visualize All locations or location errors of a selected feature within the selected alignment.
- Filter the view by selecting a section (Section 1, Section 2, Average) in the Result type selector.
- This will give you a clear visualization to help you analyze the data and make corrections.
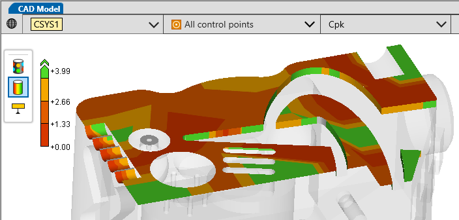
Control Point Result Visualization
Get a detailed, summarized view of your tolerated feature and see how the statistical results of the control points vary across it.
- Select the statistic (Average, Range, Std.dev, Cp, Cpk, Pp, Ppk) for control point colorization.
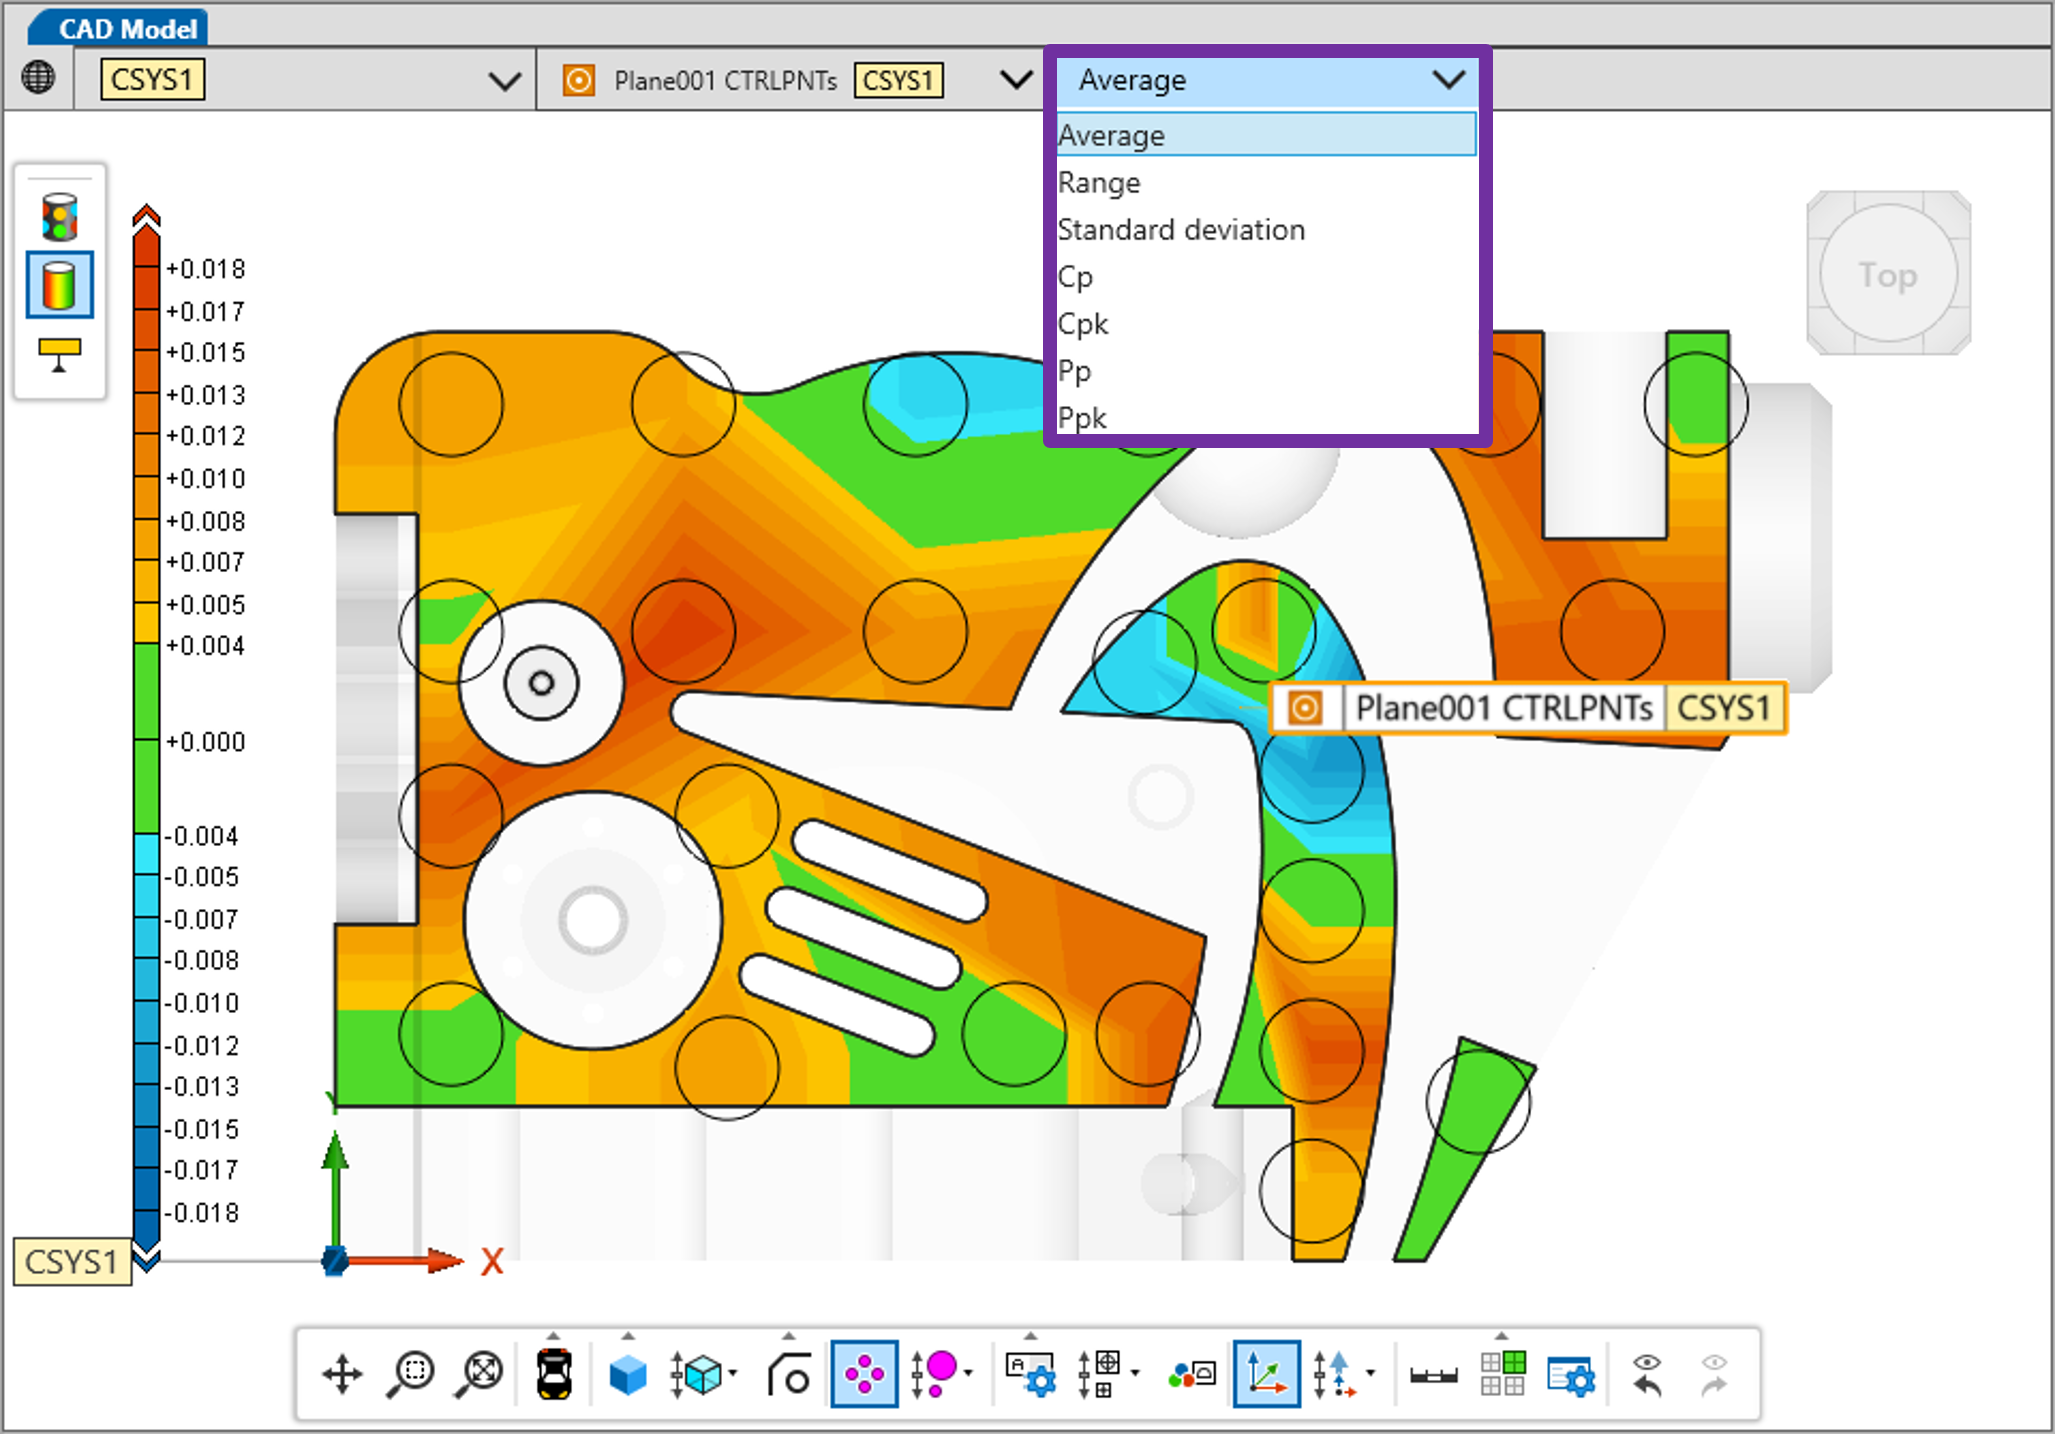
- Visualize All control points or the control points of a selected feature within the selected alignment.
“Always show all labels” display mode
- Previous versions of SPC only displayed the labels of the selected characteristics.
- Now, all characteristic labels can be visualized without selecting any characteristics.
- A new option has been introduced to control this behavior.
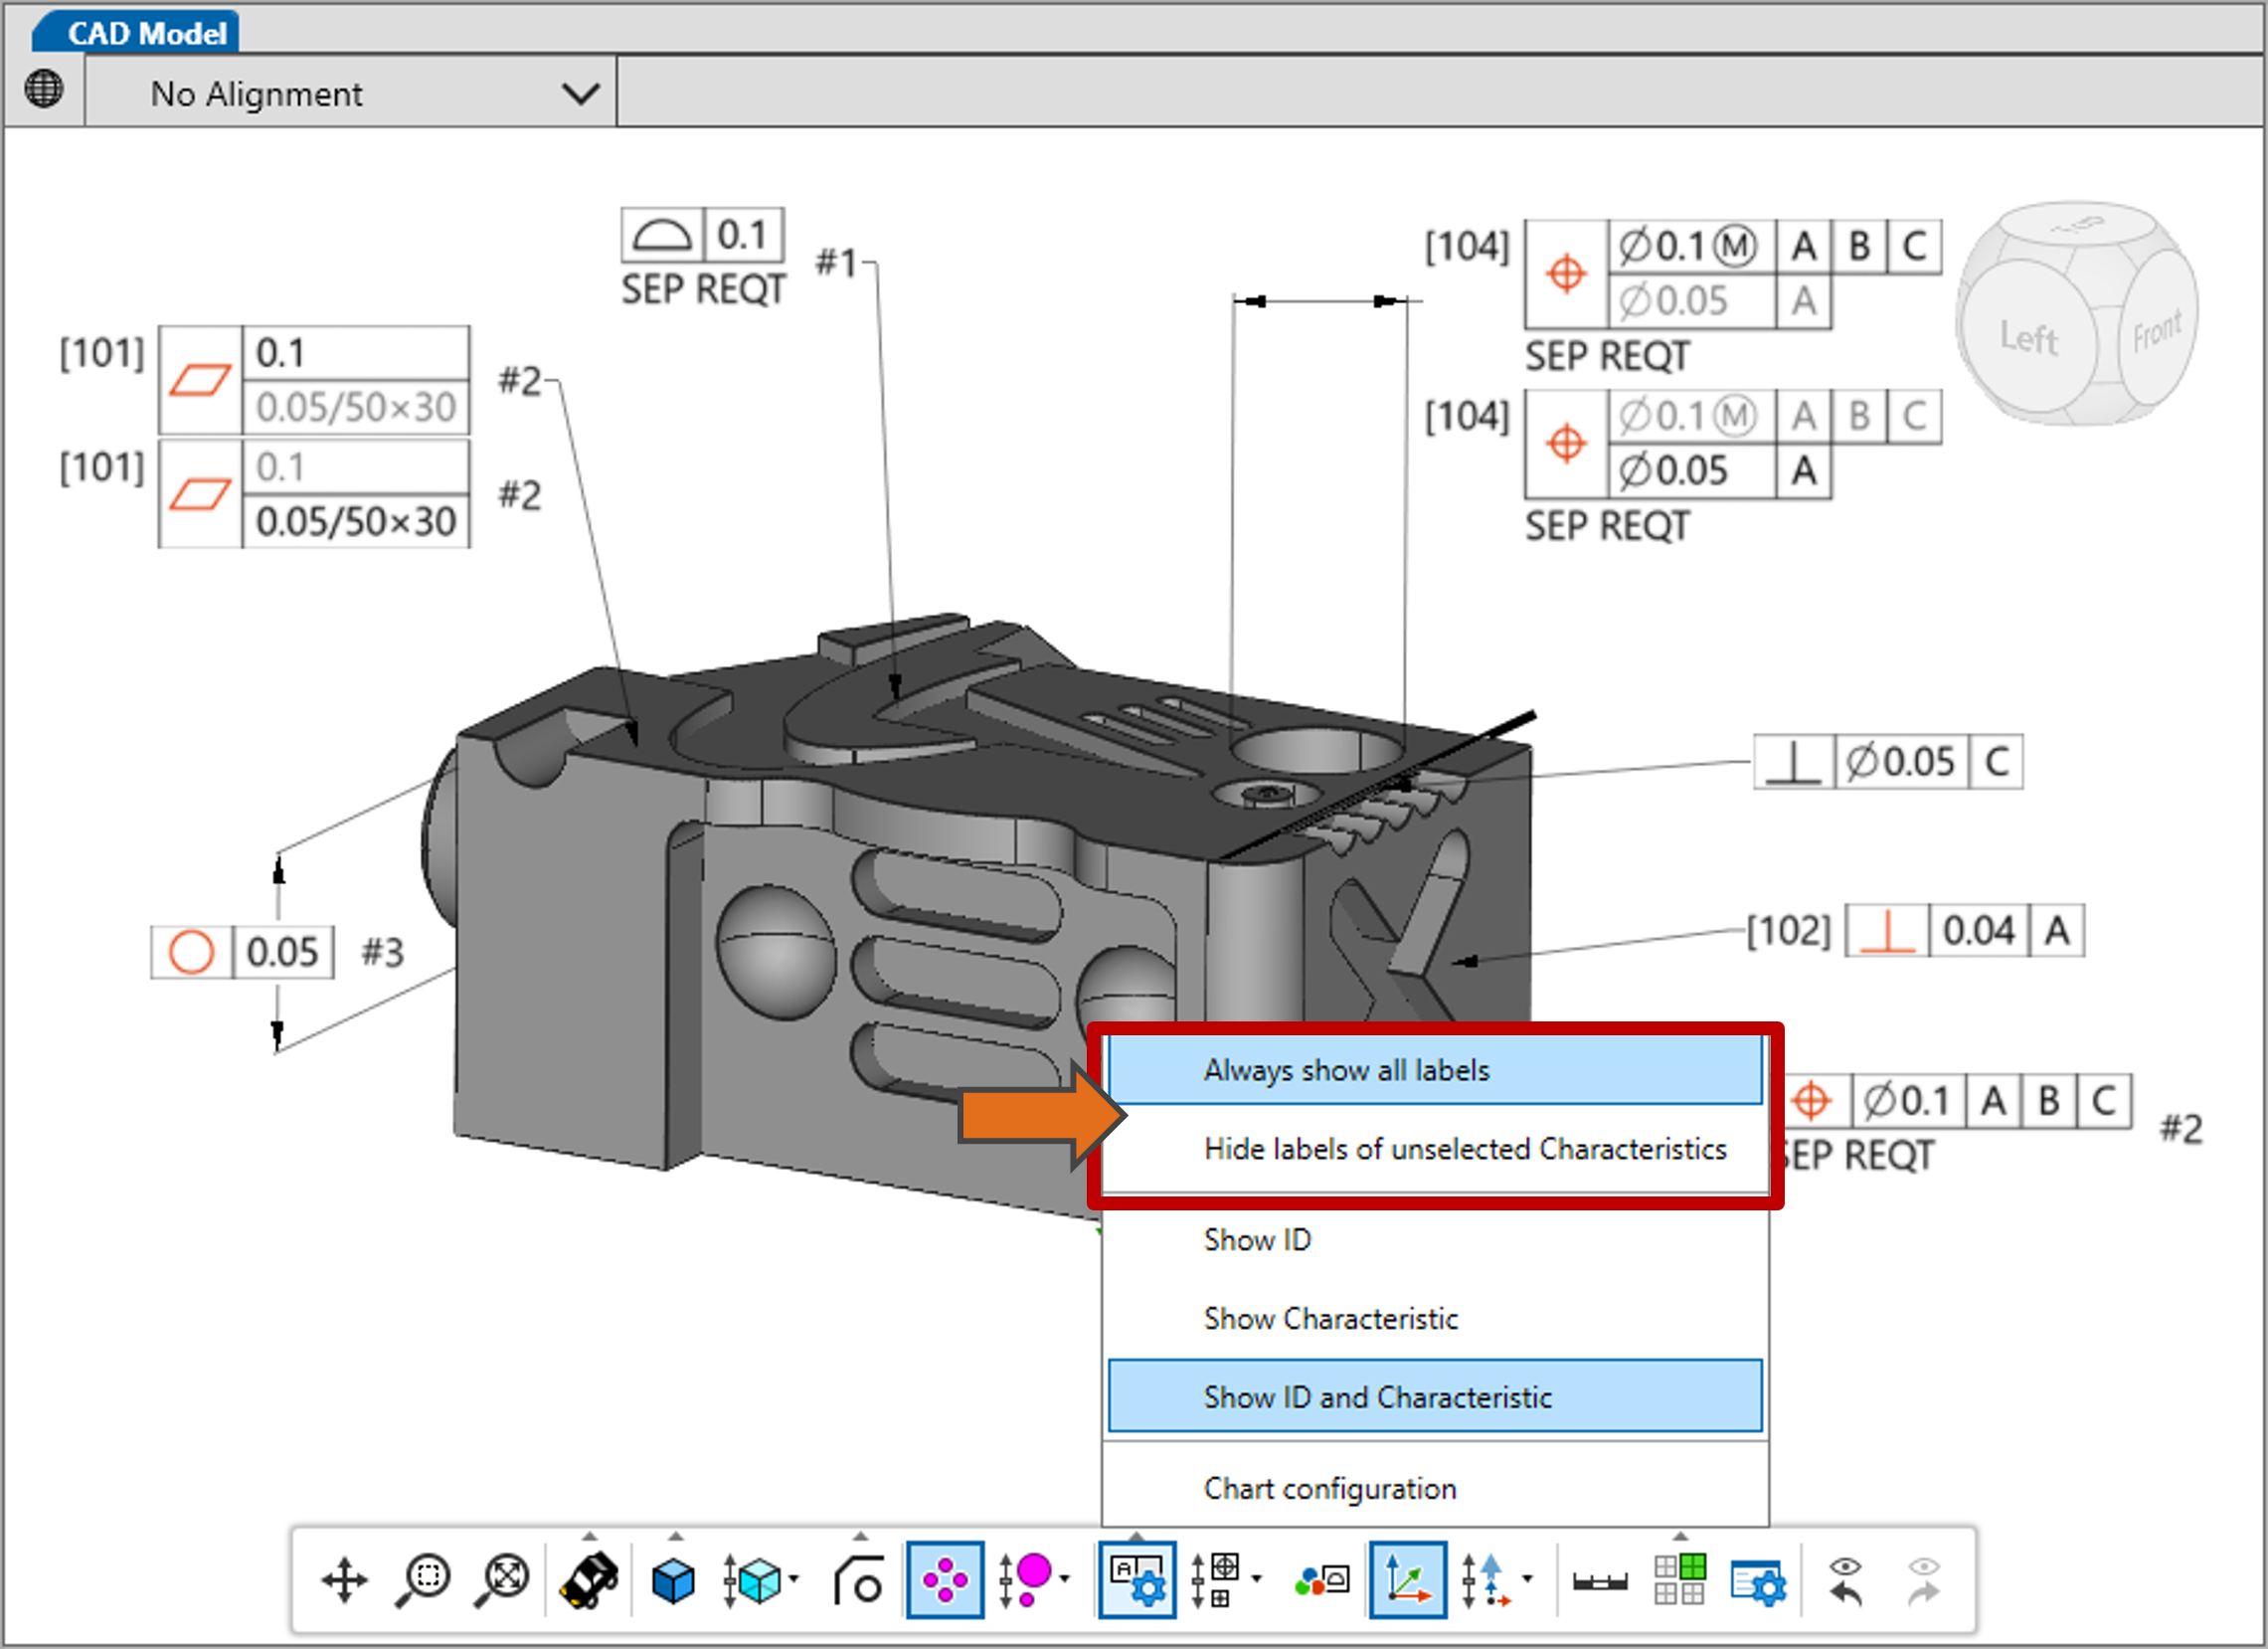
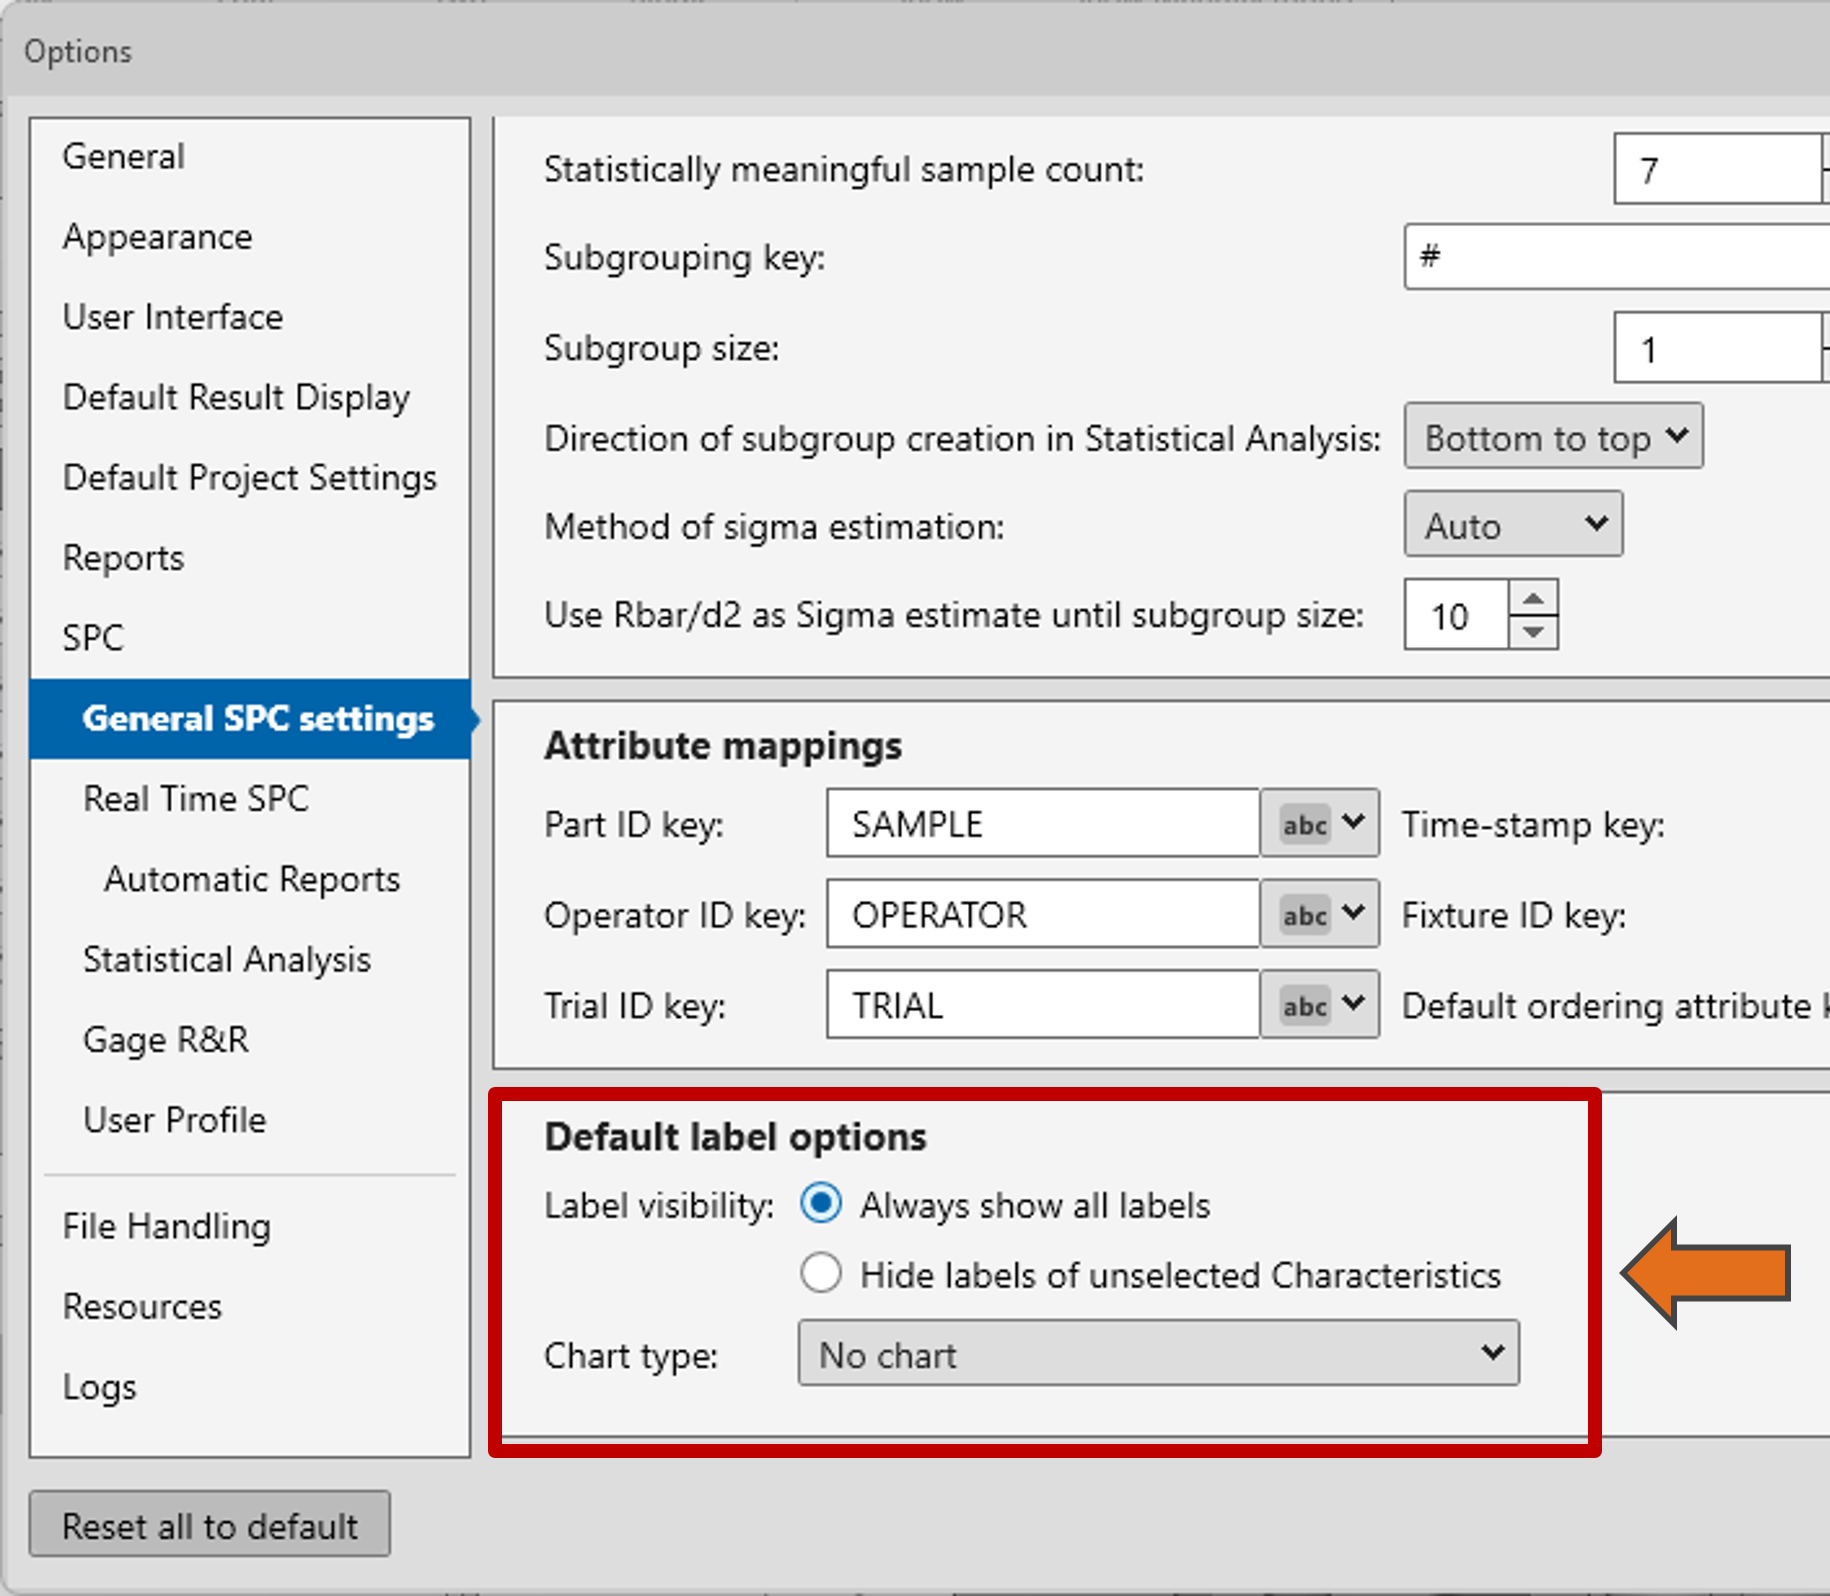
Default label options for the 3D view
New options have been added to control:
- The Label visibility in the 3D view
- Chart type
- In the past we always displayed the “Box and whisker (compact)” label.
- You can now select “No chart” to visualize only the characteristic name or choose a different chart as the default.
Further enhancements
- Performance improvements to speed up project imports and module changes.
- Improve the handling of Position tolerances with material conditions (bonus) in case of EVOLVE projects.
We hope the new features and improvements of EVOLVE Suite 12.0 will assist you to efficiently define, communicate, and monitor design intent across your manufacturing enterprise.
Feel free to contact us with any question!
 Contact Us